Visual learning
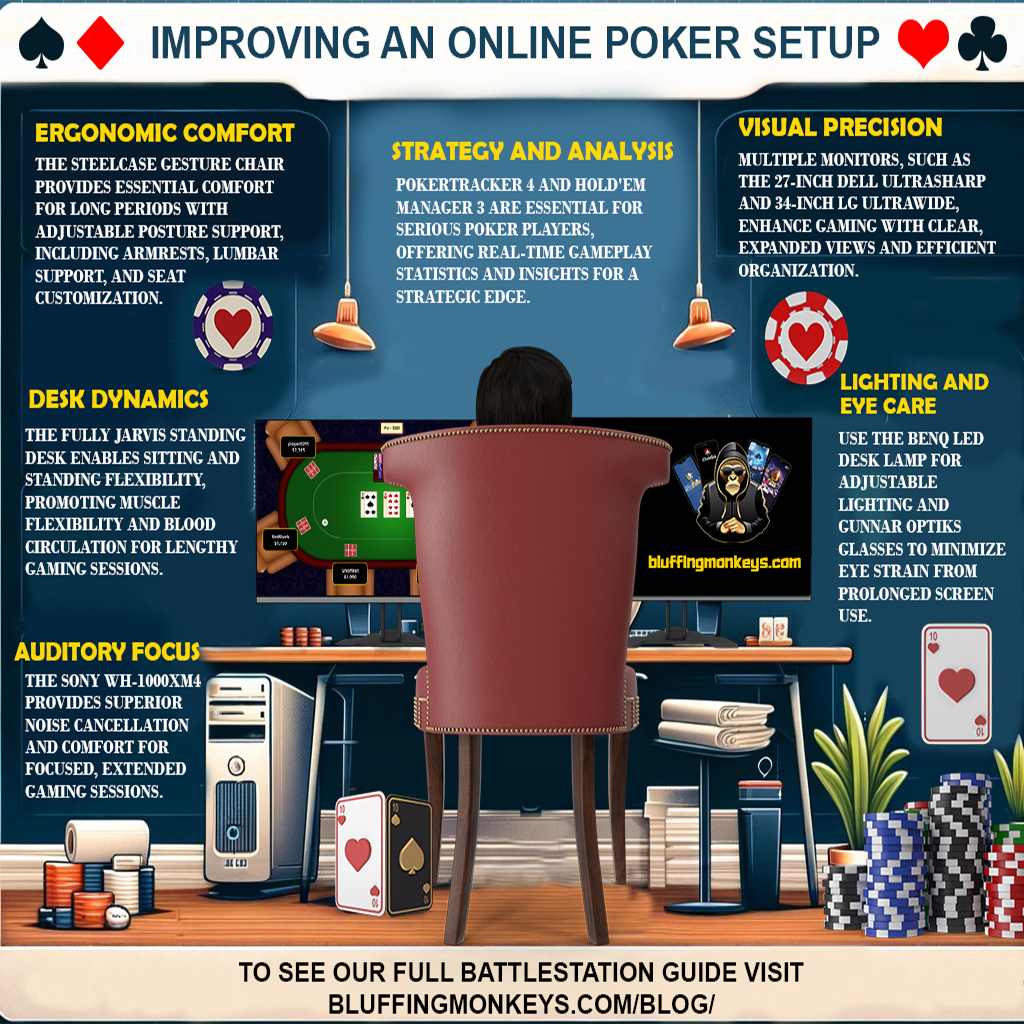
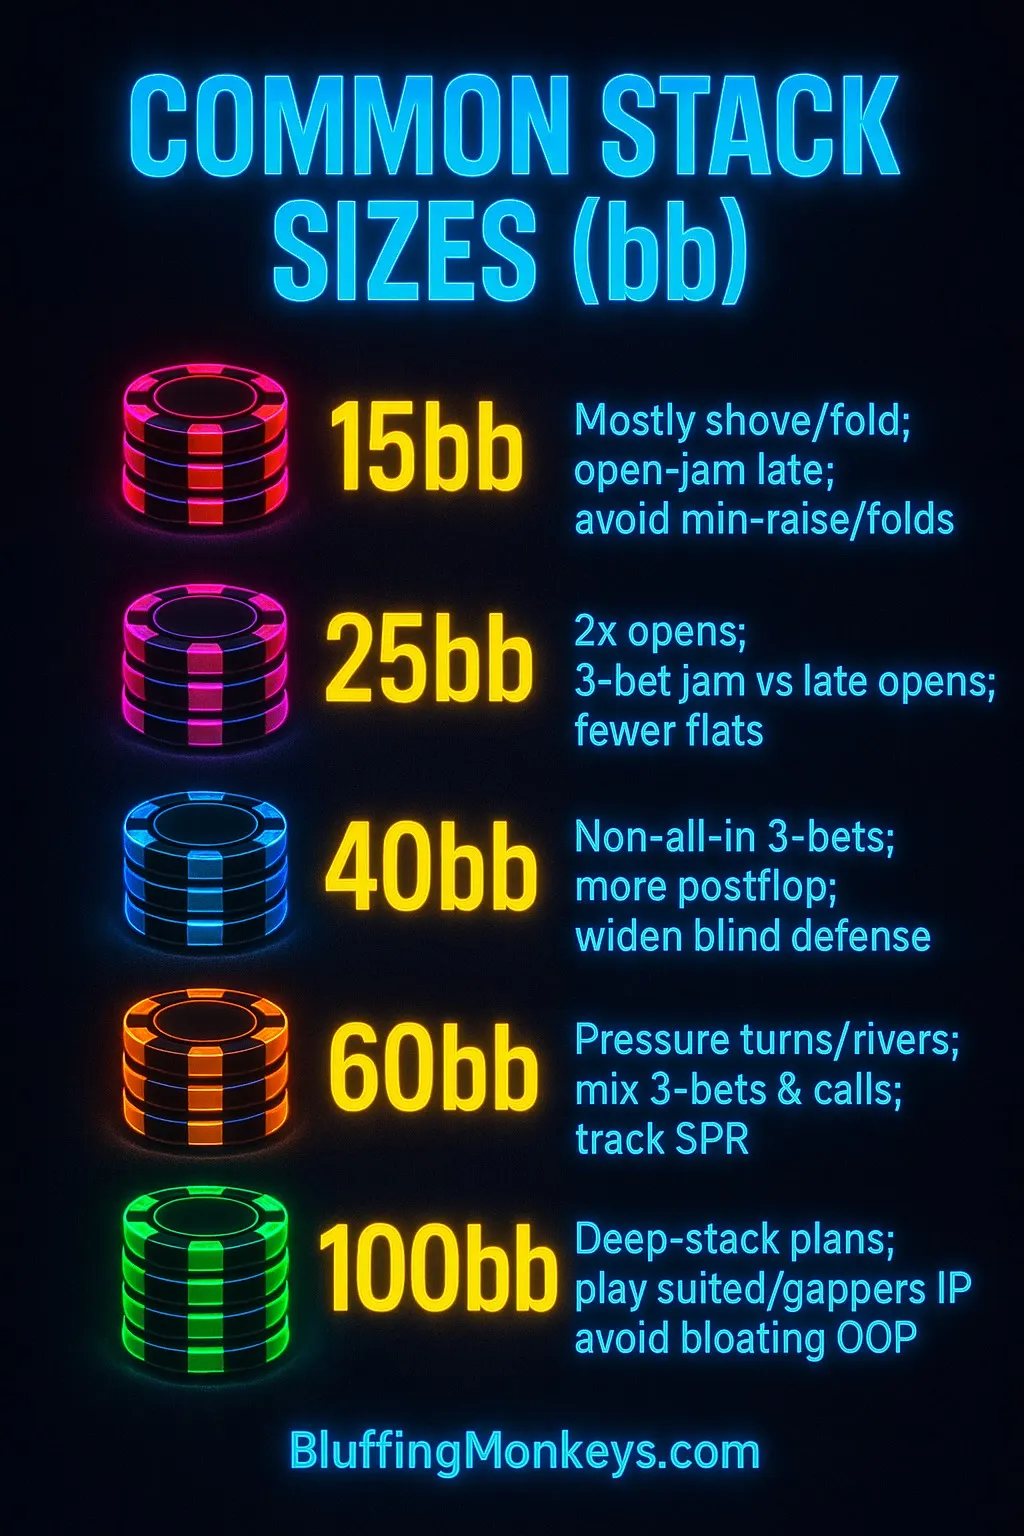
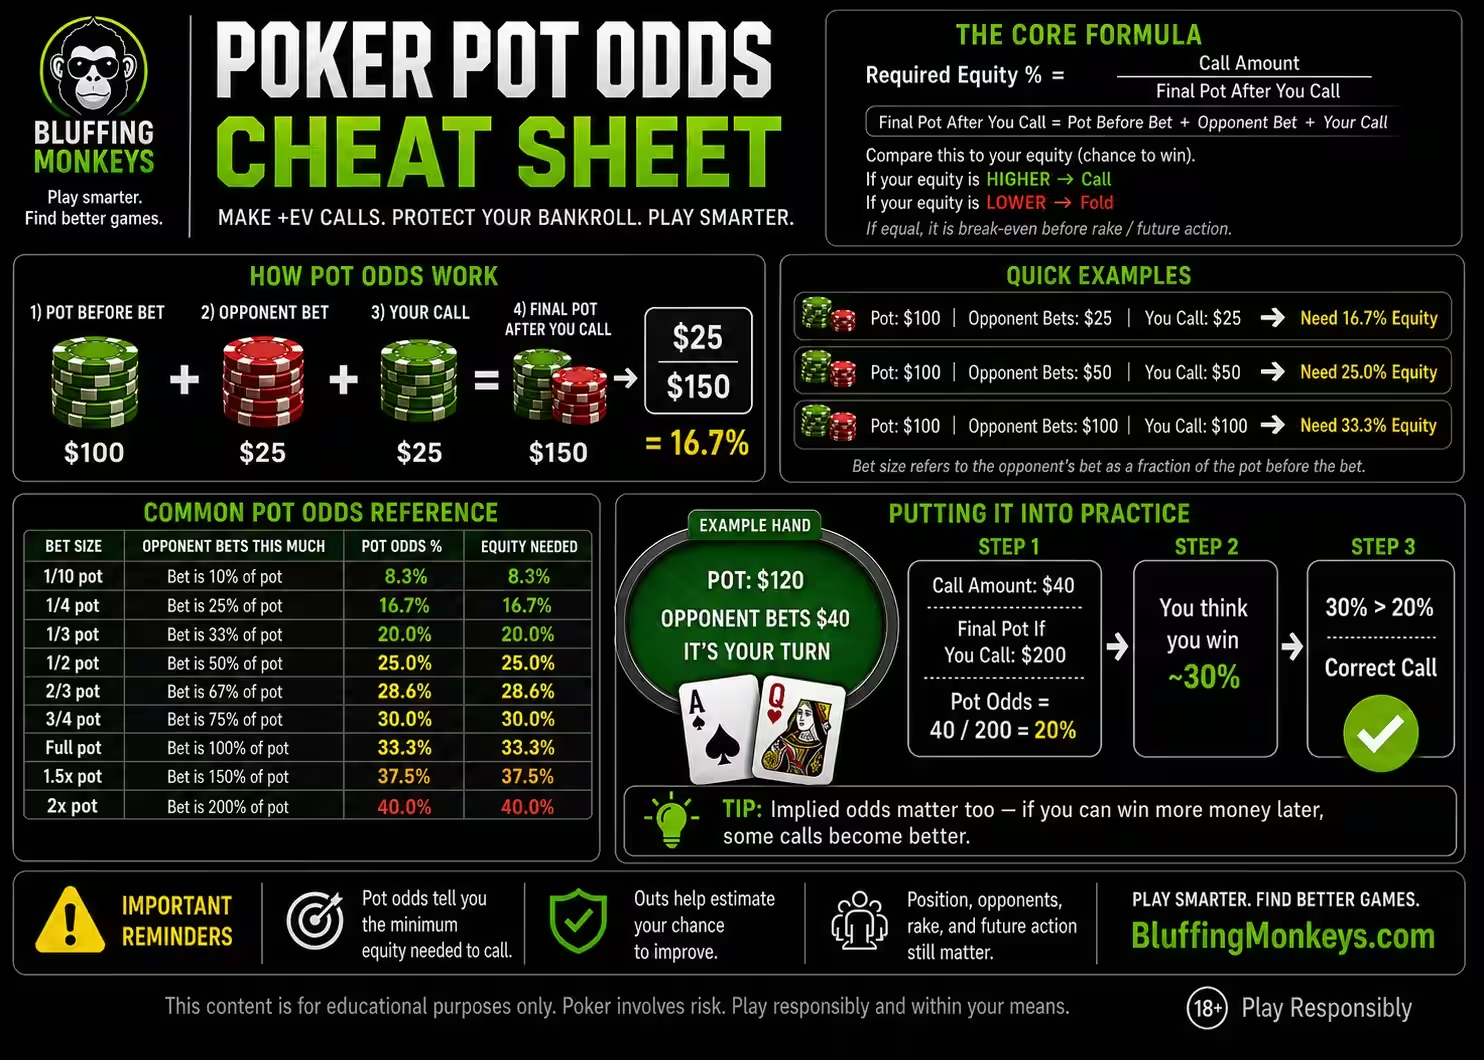
These infographics turn poker concepts into clear visual references that are easier to scan and remember.
A dedicated infographic gallery with a built-in image viewer, zoom controls, and clean mobile behavior.
These infographics turn poker concepts into clear visual references that are easier to scan and remember.
Beginners can learn the basics faster, while experienced players can use them as quick refreshers and discussion pieces.
Click any infographic to open it in a clean lightbox without sending the visitor away to the raw image URL.
The gallery and viewer are designed to stay readable and usable across phones, laptops, and large desktop screens.

From cash games in Europe to tournaments across Asia and the Americas, our community stretches across every continent. Each lit region on the globe represents an active hub of Bluffing Monkeys players, agents, and clubs joining the action right now.
Yes. All infographics in this gallery are free to view, download for personal study, and share with credit to Bluffing Monkeys. For commercial republication, please contact us first.
Yes, with attribution. You may embed any infographic on your own blog or site as long as you credit Bluffing Monkeys with a visible link back to the original page.
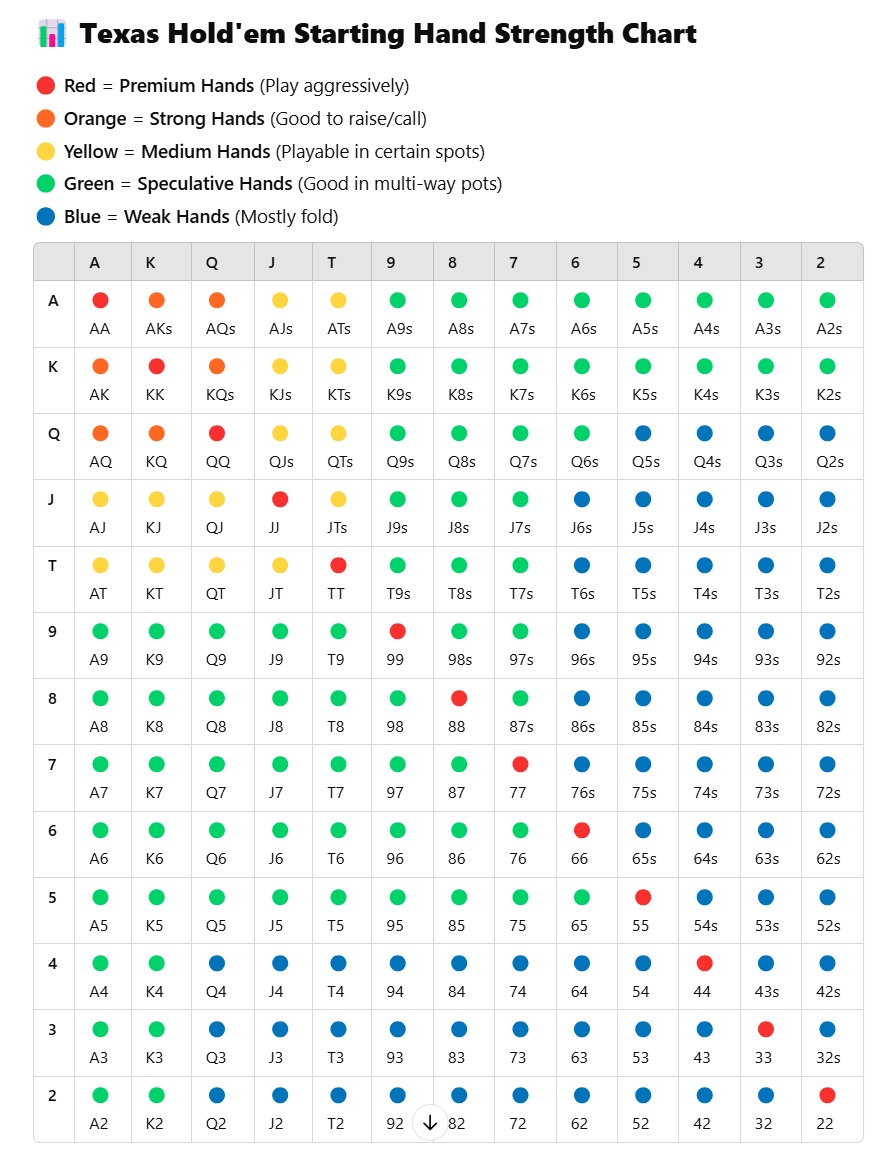
Start with the Starting Hand Strength Chart and the Pot Odds Cheat Sheet. These two cover the core decisions in nearly every hand.
Most concepts apply to both. Bankroll management, pot odds, starting hands, and tournament strategy work the same online and live.
Yes. The infographics are reviewed periodically against current solver outputs and modern game theory optimal strategy.
Click any infographic to open it in the lightbox viewer, then use your browser's right-click or long-press menu to save the full-size image.
Take what you learned from the starting hand chart and put it to work. Open the Range Analyzer.
Compare two complete ranges head to head. Open the Range Equity Calculator.
Calculate odds of any hand against any other hand or range. Open the Poker Odds Calculator.
Look up any term you see on the infographics. Open the glossary.